
[su_heading size=”17″ align=”left”]Resale Update[/su_heading]
April 3, 2019 – Toronto Real Estate Board announced that Greater Toronto Area reported 7,187 residential sales in March 2019. This result was inline with 7,188 sales reported in March 2018. For the first quarter of 2019, sales were down by one per cent compared to Q1 2018.
“The OSFI stress test continues to impact home buyers’ ability to qualify for a mortgage. TREB is still arguing that the stress test provisions and mortgage lending guidelines generally, including allowable amortization periods for insured mortgages, should be reviewed. The supply of listings in the GTA also remains a problem. Bringing a greater diversity of ownership and rental housing online, including ‘missing middle’ home types, should be a priority of all levels of government. TREB is happy to be taking part in the City of Toronto’s consultations for the Housing TO – 2020-2030 Action Plan, and will certainly be raising the supply issue during these discussions,” said Toronto Real Estate Board President, Mr. Bhaura.
The MLS® Home Price Index Composite Benchmark was up by 2.6 per cent year-over-year in March, while the average price for March sales was up by a lesser annual rate of 0.5 per cent to $788,335. The average selling price for Q1 2019 was up by 1.1 per cent year-over-year.
“Market conditions have remained tight enough to support a moderate pace of price growth. Despite sales being markedly lower than the record levels of 2016 and early 2017, the supply of listings has also receded. This means that in many neighbourhoods throughout the GTA, we continue to see competition between buyers for available listings, which provides a level of support for home prices,” said Jason Mercer, TREB’s Chief Market Analyst.
[su_heading size=”17″ align=”left”]Pre-construction Update[/su_heading]
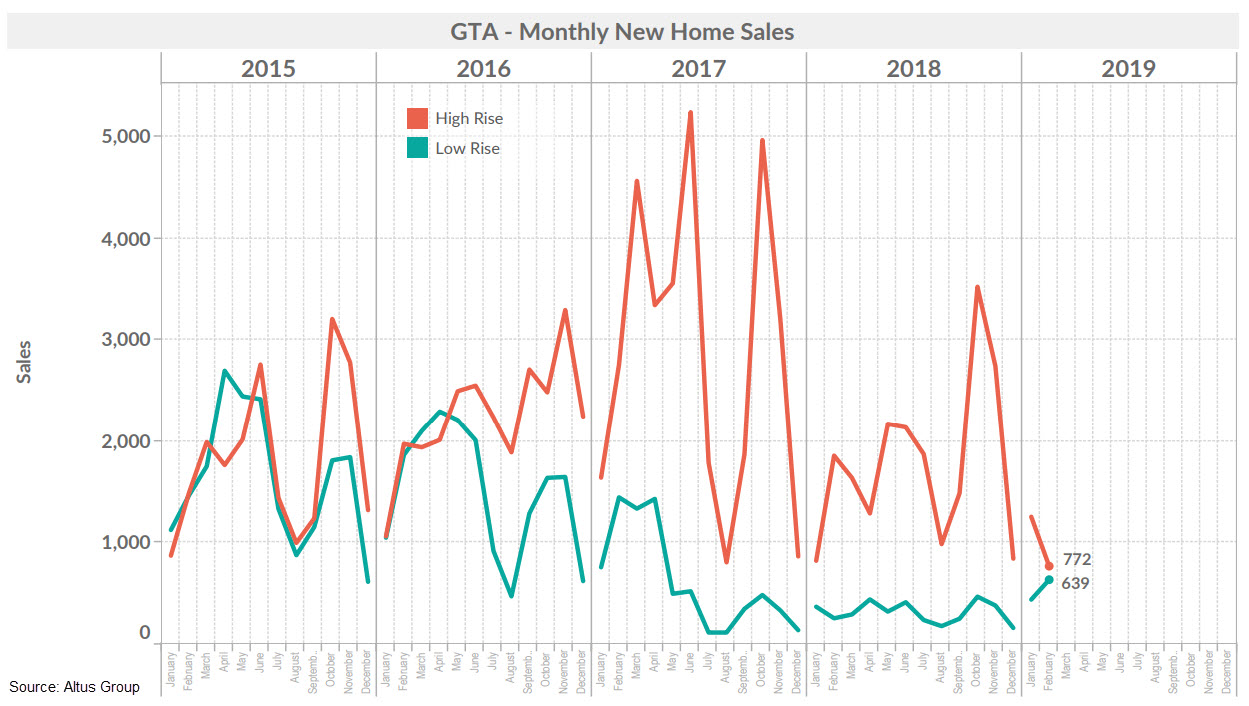
Monthly New Home Sales
There were 1,411 total new home sales in February 2019, with 639 Low Rise sales, up +147% from February 2018 and 772 High Rise sales, down -58% from February 2018.
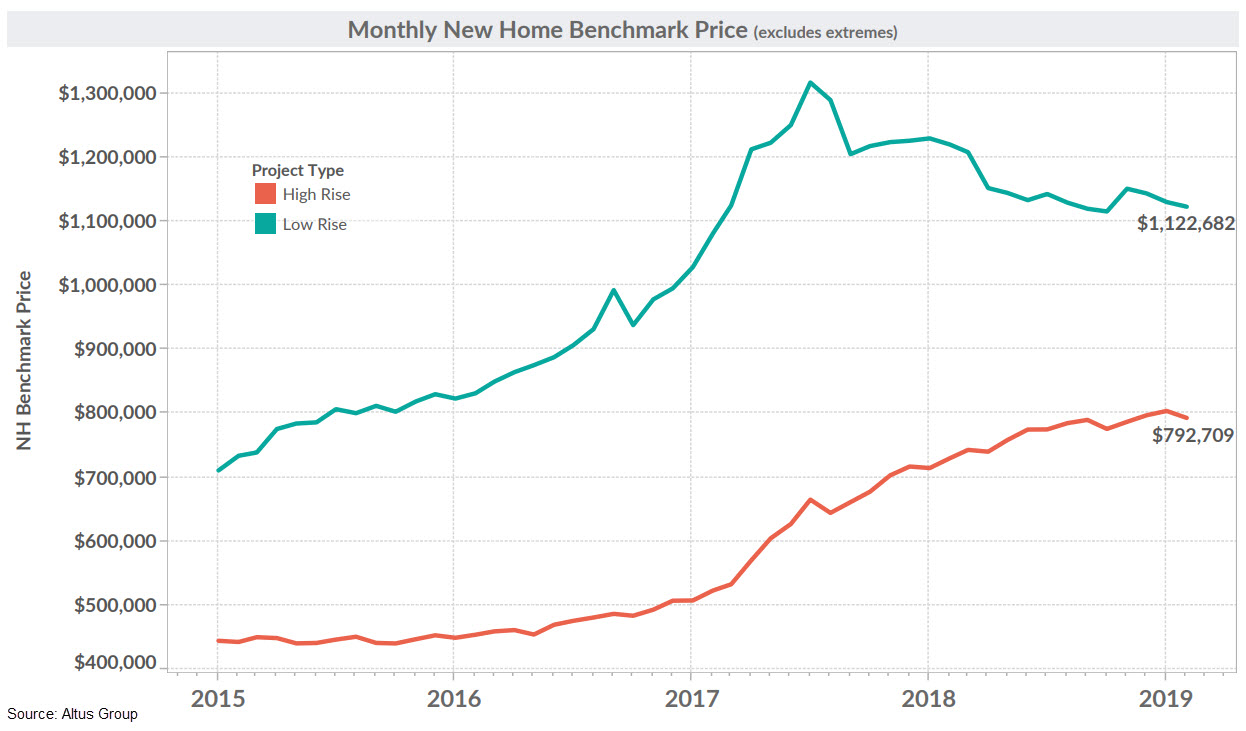
New Home Benchmark Price – April 2019
The New Home Benchmark Price tracks the average Low and High Rise home or unit price in the Greater Toronto Area for a particular month and compares it to the previous month in the same year and to the same month in the previous year.
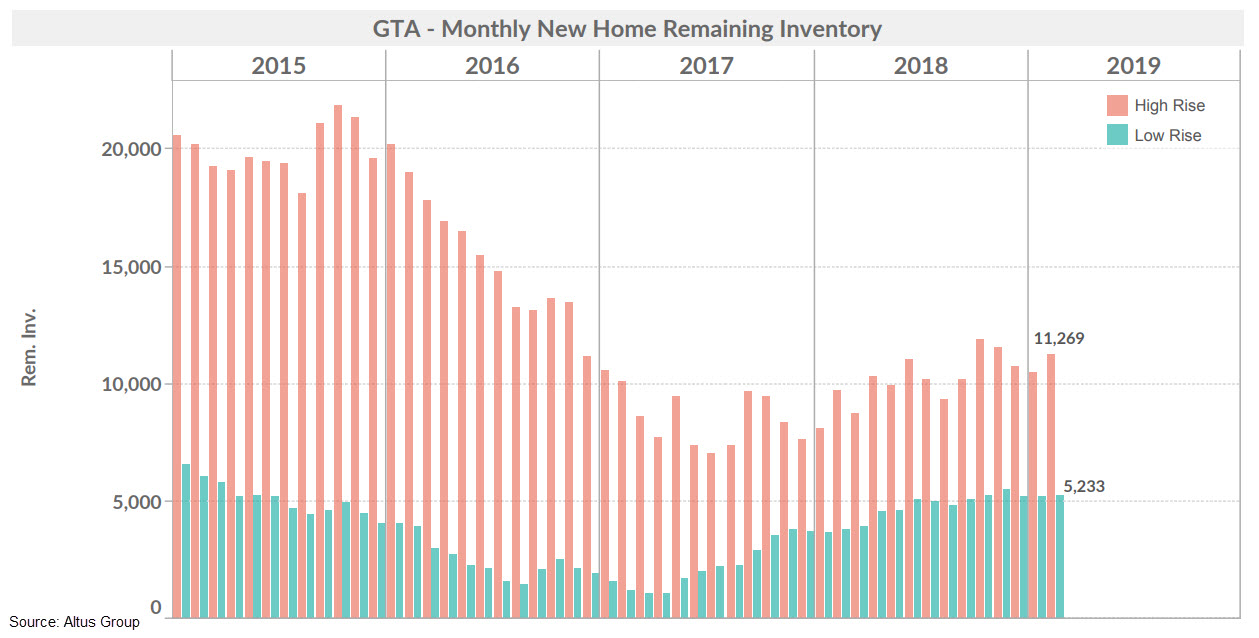
Active Sites and Inventory
As of February 2019, there were 274 active Low Rise sites in the Greater Toronto Area and the total unsold inventory was 5,233 lots. The total number of active High Rise sites was 330, with a total unsold inventory of 11,269 units.
Featured Projects
Please visit here for a list of active and coming soon projects.